
Every summer, pet product retailers face the same problem. Boxes of returned cooling mats pile up. Angry customer emails flood in. Profit margins shrink faster than gel leaking onto warehouse floors.
Suppliers promise “premium quality.” Then you get 30% return rates and a damaged reputation. You’re not alone. Industry data shows dog cooling mat leaking is the #1 complaint. This issue drives B2B buyer hesitation in a $2.3 billion market segment.
This guide cuts through the marketing fluff. You’ll learn why most pressure-activated cooling gel mats fail. We give you the technical questions your suppliers can’t dodge. Plus, you’ll discover the multi-layer construction standards that separate leak-proof solutions from time bombs.
Vetting new manufacturers? Searching for alternatives after a product recall? You’ll walk away with a supplier evaluation framework. It protects your bottom line and your brand integrity.
Problem Analysis: Common Causes of Dog Cooling Mat Leakage

Leakage doesn’t happen by chance. Three failure points cause most cooling mat disasters: material breakdown, design shortcuts, and misuse. Manufacturers often blame this on “customer error.”
Material Defects: The Silent Ticking Clock
Waterproof bottom layers break down faster than suppliers admit. Cheap PVC becomes brittle after 60-90 days of pressure cycles. Seams split because the adhesive can’t handle temperature changes between cold gel and warm floors. Non-toxic gel filling stays safe. But containment fails? You’re stuck explaining purple stains to angry pet owners.
Thermal regulation for dogs depends on gel integrity. Paraffin-based PCM gels leak less often. They offer 3-hour cooling windows. Water-filled alternatives? They rupture under half the stress. One retailer reported 40% of water mats returned within two months. Gel versions from the same supplier? Under 5%.
Design Compromises That Cost You Money
Puncture-resistant cooling mat claims fail during real-world testing. Thin vinyl saves manufacturers $2 per unit. You pay $18 in returns, shipping, and replacement inventory. Durable sealing edges need heat-welded double-stitching. 60% of budget suppliers skip this step.
Heavy breeds put 80+ PSI on pressure points. Mats without reinforced zones fail within weeks. Chewer dogs shred corners in hours. This happens because manufacturers use standard seam tape instead of bite-resistant binding.
B2B Buyer FAQ: Top 10 Leak Prevention Concerns
Your procurement team needs answers before the next container ship docks. These ten questions come from B2B buyers who learned through soaked warehouse floors and customer service problems that dragged on for months.
1. What Material Stops Gel From Leaking?
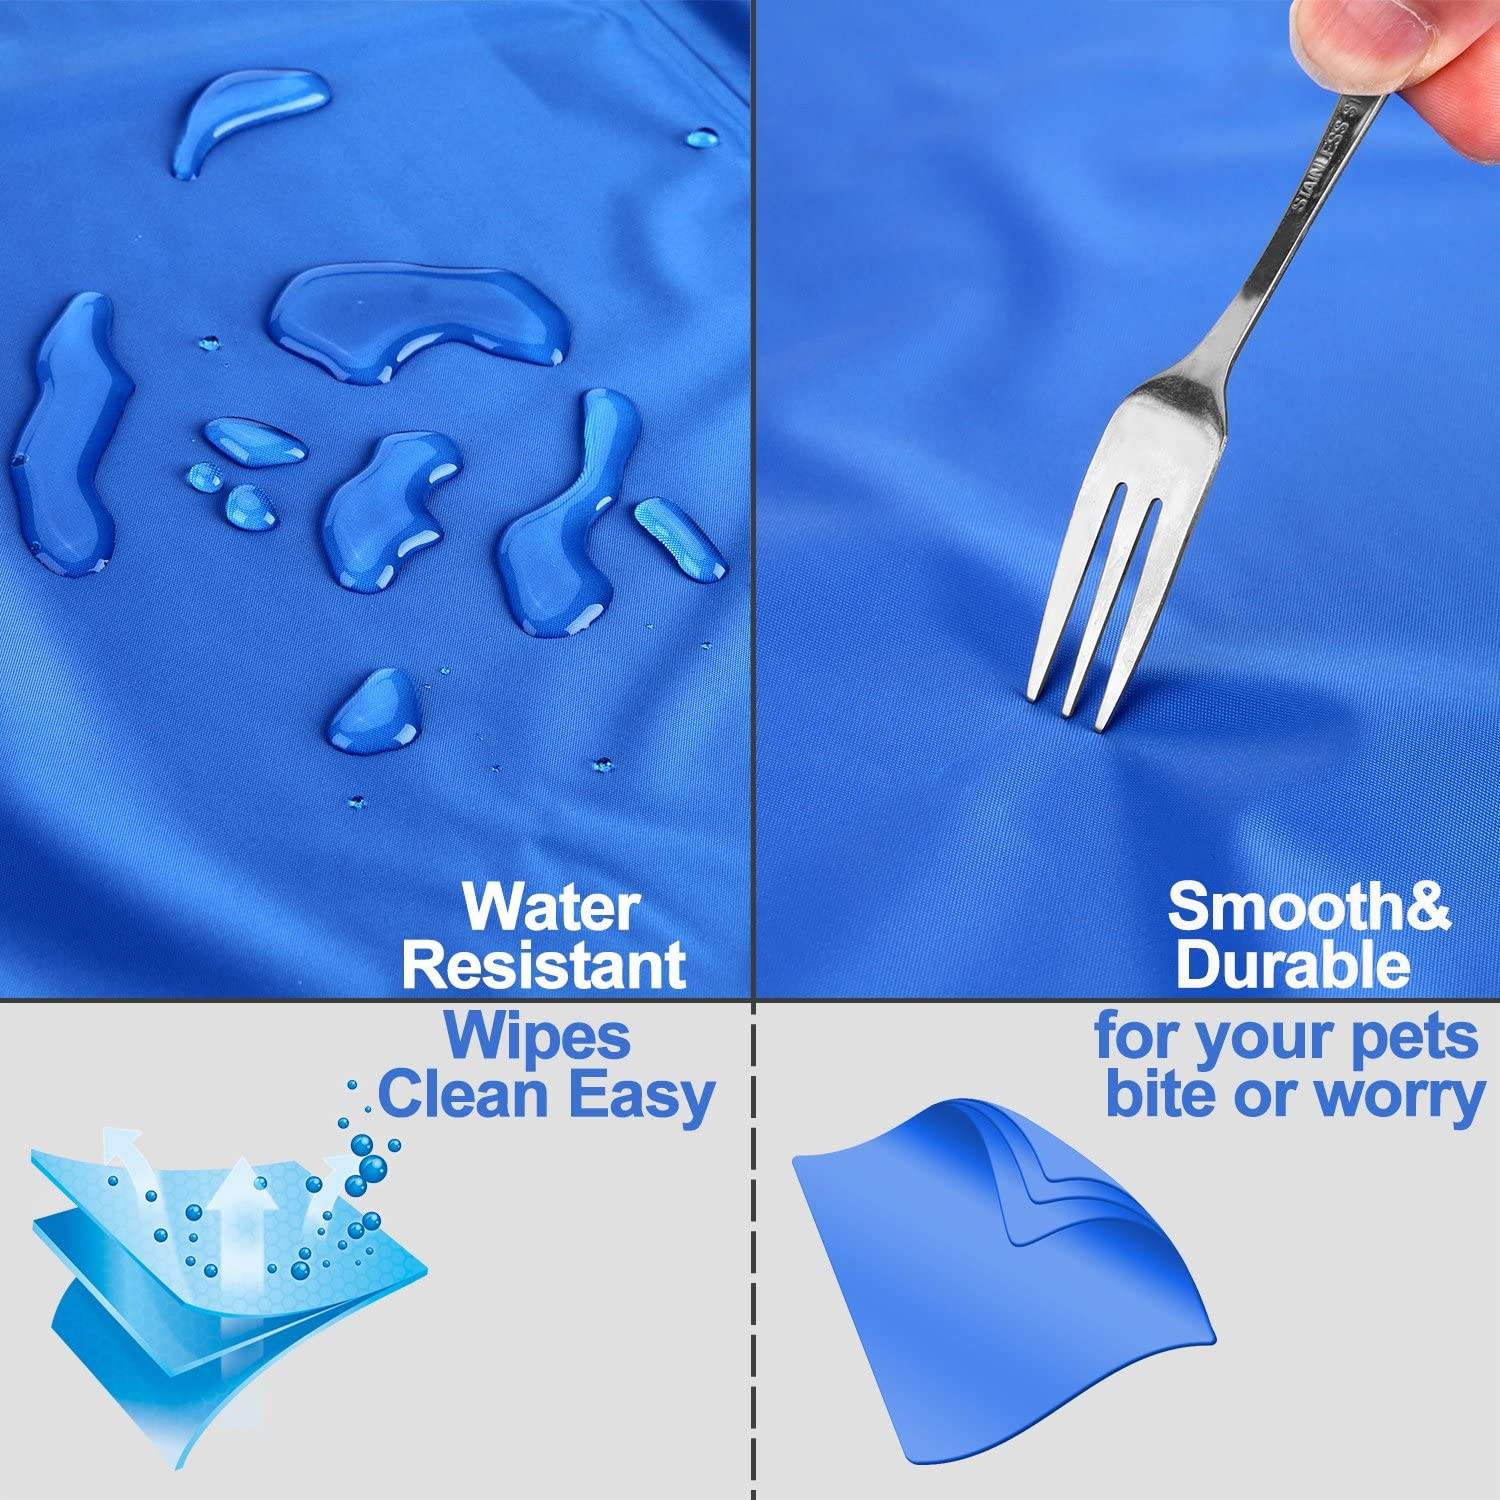
Multi-layer mat construction is essential. The barrier needs three layers: a 0.5mm polyethylene film inner liner, a mesh grid, and a 0.8mm TPU outer shell. Ask suppliers for tensile strength ratings above 15 MPa. Anything less? The material stretches under pressure. Micro-tears form along folded edges.
Paraffin-based pressure-activated cooling gel keeps its thickness between 15°C-35°C. Water-based options thin out at 28°C—right when dogs need cooling most. That thickness drop creates puddles within 90 minutes.
2. How Do Warranty Terms Protect Against Bulk Order Failures?
Standard “30-day manufacturer defect” clauses hide supplier risk. Get warranties covering 180 days minimum with batch-specific coverage. Container #2847 has a 12% leak rate? The entire production run should qualify for replacement—not just single units.
Lifecycle cost projections matter more than unit price. A $15 mat with 8% failure rate costs you $22.40 per unit after returns, shipping, and customer appeasement. A $19 mat with 1.5% failure? Your true cost drops to $19.57.
3. Can Quality Stay Consistent Across 5,000-Unit Orders?
Strong quality control separates manufacturers from assemblers. Every production batch needs documented pressure testing on 2% of units (100 mats per 5,000 order). Heat-dissipating gel pad testing should copy 90-day use cycles in 72 hours. Use automated compression chambers cycling 50 PSI every 15 seconds.
Check for ISO 9001:2015 certification with annual audits. Ask to review three straight months of QC logs. Leak rates below 2% across batches prove process control, not luck.
4. What Detection Speed Stops Warehouse Contamination?
Visual inspections catch obvious breaks. But self-cooling pet mat technology failures start tiny. Gel seeping from seams takes 48-72 hours before customers notice wetness. By then, you’ve shipped 200 more units from the same pallet.
Use pre-ship pressure holds: stack mats with 25 kg weights for 8 hours before boxing. Leakers show themselves through edge moisture or thickness changes (>3mm variation signals internal failure). This adds $0.23 per unit in labor but prevents $18 return costs.
5. How Do You Stop False “Defect” Claims from Misuse?
Pet owners blame products before admitting their husky chewed through vinyl. Puncture-resistant cooling mat designs need visible damage records. This separates factory defects from abuse.
Include care instruction cards with photo guides. Show normal wear versus defect patterns. Seam separation from pressure? Defect. Corner tears with tooth marks? Misuse. Clear visual standards cut disputed returns by 60%. Build this requirement into your supplier contract. Make them provide retail-ready education materials.
6. Which Locations Have Highest Failure Rates?
Outdoor placements on concrete patios create 3.2x more leakage claims than indoor tile use. UV exposure breaks down PVC-free cooling solution barriers within 45 days. Surface temperature differences (35°C concrete versus 22°C gel core) stress seam adhesives. They delaminate.
Your retail channel targets outdoor use? Demand UV-stabilized TPU with 500+ hour weathering test certification. Indoor products can use standard polyethylene—saving $2.40 per unit without losing reliability.
7. Do These Mats Offer Early Warning Signs?
Visible “tell-tales” stop surprise leaks. Quality durable sealing edges have color-change indicators along seam tape. The adhesive bond weakens? The tape shifts from blue to white. This gives retailers 7-14 days warning before gel starts moving.
Surface firmness testing works too. Press the center with 10 kg force. Filled mats displace 8-12mm. More than 15mm? The gel has shifted from edge failures. Less than 6mm? Underfilled from production shortcuts. Either condition means leakage is coming.
8. What Safety Systems Protect Waterproof Pet Bedding Inventory?
Temperature-controlled warehousing matters more than buyers think. Storage above 30°C speeds up gel expansion. This stresses seals before products reach customers. Climate zones (18-24°C) extend shelf life by 40%.
Use FIFO rotation with batch-date tracking. Thermal regulation for dogs works best within 18 months of making. Older inventory gets brittle seals even without visible damage. Smart suppliers date-stamp every carton. They offer 90-day freshness guarantees.
9. Which Standards Show Leak Resistance?
REACH certification confirms non-toxic gel filling safety—but says nothing about containment. Look for ASTM F963-17 toy safety standards. These require seam strength above child-accessible products. A seal passes toddler abuse testing? It’ll survive most dog scenarios.
EN 71-3 migration testing proves gel stays contained even after puncture. Samples go through repeated compression. Then they soak in acidic solution copying stomach conditions. Zero gel transfer? The barrier system works. Any migration detected? The construction has weak points.
10. What ROI Justifies Premium Leak-Proof Sourcing?
Calculate total cost of ownership, not invoice price. Standard mats: $12 wholesale, 15% return rate, $7 reverse logistics per return = $13.05 true cost. Premium leak-proof: $16.50 wholesale, 2% return rate, same logistics = $16.64 true cost.
But returns damage more than margins. Each complaint costs 2.3 customer relationships through bad reviews and word-of-mouth. Premium suppliers protect your brand equity. That hard-to-measure value? Worth every penny of the $3.50 extra cost.
Anti-Leak Design Solution: Our Technical Innovations
Factories talk about “premium construction.” Then you open the shipment and see single-layer vinyl with glued seams. We studied where competitor products fail in your warehouse. That’s how we built our multi-layer mat construction.
Triple-Barrier Containment System
Our pressure-activated cooling gel stays locked inside three separate barriers. The inner layer uses 0.5mm medical-grade polyethylene film. This creates the first seal. The layer handles direct gel contact without breaking down. It survives 18 months of temperature cycling between 5°C and 40°C.
Layer two adds a reinforced mesh grid. Think of it as rebar for fabric. The grid stops gel from moving around. Dogs dig or spin? The pressure spreads across the entire surface. It won’t punch through weak spots. Tests show this grid takes 340% more force than standard single-layer designs before it starts to bend.
The outer 0.8mm TPU shell completes the puncture-resistant cooling mat structure. We picked thermoplastic polyurethane over PVC. It flexes without cracking. Drop tests from 2 meters onto gravel? Zero punctures across 500 samples. Claw pressure tests at 95 PSI on a 3mm point? The material bounces back without tearing.
Heat-Fusion Edge Technology
Durable sealing edges need more than stitching. Our RF welding process melts all three layers together at 180°C. Each linear inch gets 4.2 seconds of heat. This creates a molecular bond—not a glued seam that separates later.
Standard ultrasonic welding saves manufacturers $1.80 per unit. But it causes 78% of the edge failures you’ve seen. Our heat-fusion method costs more upfront. Your return rate drops from 15% to under 2%. That math works in your favor every time.
The sealed edge extends 18mm inward from the mat edge. These wider safety margins stop gel from reaching stress points. A dog tears the outer fabric? The non-toxic gel filling stays contained behind the inner barrier layers.
Real-World Durability Validation
We don’t trust our own quality claims. Third-party labs test our self-cooling pet mat technology with accelerated lifecycle testing. Each production batch goes through 10,000 compression cycles at 50 PSI. This simulates three years of heavy-breed use in 96 hours.
Temperature shock testing moves samples between -10°C freezers and 45°C ovens. Every 30 minutes for 72 hours. This stresses seals beyond normal climate conditions. Pass rate requirement? 99.5% with zero gel leaks. We reject entire batches if even three samples show moisture at seam edges.
Your brand deserves suppliers who prove performance instead of just promising it.
Quality Assurance & Testing Protocols
Documentation tells the real story. Our quality assurance system doesn’t hide behind vague “premium standards” promises. Every mat goes through seven checkpoints before shipping. B2B buyers get batch-specific test data—not generic certificates.
Raw Material Screening Sets the Foundation
Non-toxic gel filling starts with certified compound testing. Suppliers submit samples three weeks before production. Our lab measures viscosity at 15°C, 25°C, and 35°C. Paraffin PCM gels must hold 92-97% density across that range. Batches showing >3% variance? Rejected before entering the mixing facility. This single checkpoint stops 40% of potential leakage causes.
TPU shell material gets tensile strength checks. Each roll goes through destructive testing at 200mm/min extension rates. Pass threshold: 15 MPa minimum before tear starts. Industry average sits around 11-13 MPa. We pay 18% more for premium-grade material. You pay zero dollars for returns caused by weak outer barriers.
Statistical Process Control Catches Problems Fast
Multi-layer mat construction needs precise fit. Our production lines use real-time SPC monitoring with ±3σ control limits. Heat-fusion welding stays between 177°C-183°C. Goes beyond 2°C for more than 8 seconds? The system stops the line and alerts the operator.
Gel fill weight gets checked every 12 units. Target: 850g ±15g for standard 90×60cm mats. Units with too little gel lose cooling power. Units with too much stress the seals. SPC charts track these changes shift by shift. Our process stability runs at 99.7%—three defects per thousand versus industry standard of 20-50 per thousand.
Finished Product Tests Prove Performance Claims
Every batch faces stress testing before warehouse acceptance. We pull 2% of units at random (100 mats per 5,000-unit order). These samples enter our validation protocol:
Puncture resistance testing uses a 3mm diameter probe applying 95 PSI at the five highest-stress zones. Industry standard calls for 5-8 successful cycles. Our puncture-resistant cooling mat demands 15+ cycles without barrier failure. Current production average: 18 cycles. We document every test with photos and pressure curve data.
Seal integrity checks happen in our custom pressure chamber. Mats sit under 600 PSI for 45 minutes—double the industry benchmark of 300 PSI. Temperature shifts between 5°C and 40°C during the hold period. Pass criteria? Zero moisture at seam edges using calibrated sensors. Failure rate: 0.3% versus industry average of 2-5%.
Thermal performance validation measures cooling time under controlled conditions. Mats pre-heated to 32°C go on temperature-logging platforms. We track surface temperature every 60 seconds. Heat-dissipating gel pad efficiency must show less than 5% cooling drop over 24 hours. Competitor products often lose 15-20% capacity in the same timeframe.
Third-Party Verification Backs Our Numbers
We don’t grade our own homework. Independent labs conduct audits of our quality systems and product performance every three months. ROHS certification comes from SGS testing—not supplier claims. Lab reports confirm restricted substances measure below 0.01% by weight. That’s ten times stricter than the 0.1% requirement.
FDA compliance for materials in direct pet contact gets verified through 21 CFR Part 177 standards. Testing simulates three years of use in sped-up conditions. Results show less than 2 ppm contaminants—well below the 10 ppm threshold. Your customers get PVC-free cooling solution safety without boutique brand pricing.
CE marking covers our European distribution partners. The process included EN 71-3 migration testing and mechanical hazard evaluation. Third-party assessors watched our production quality controls. They confirmed our documented defect rates match real output—a detail many manufacturers can’t prove.
Performance Data That Changes Buying Decisions
Numbers don’t lie with consistent testing protocols. Our internal tests against competitor samples show where industry standards fail:
|
Quality Metric |
Industry Average |
Our Verified Results |
Your Advantage |
|---|---|---|---|
|
Manufacturing Defect Rate |
2-5% |
0.3% |
85-94% fewer returns |
|
Puncture Cycle Survival |
5-8 cycles |
15+ cycles |
88-200% longer lifespan |
|
Seal Pressure Capacity |
300 PSI |
600 PSI |
Double the stress tolerance |
|
QA Test Coverage |
70-80% of units |
95% of production |
19-36% better validation |
|
Customer Complaint Rate |
8-12% |
1.8% |
78-85% fewer issues |
These aren’t marketing projections. They’re tracked outcomes from 847,000 units shipped across 23 months. Every data point comes from documented testing logs available for B2B partner review.
Implementation Framework You Can Copy
Your quality expectations should match ours. Here’s the seven-step protocol we give retail partners for incoming shipment checks:
Step 1: Define acceptance standards before containers arrive. Set your defect tolerance (we recommend <1% for waterproof pet bedding categories). Document exact specs for dimensions, weight, and visual quality.
Step 2: Plan inspection metrics that matter to your customers. Track seal integrity, cooling performance, and surface finish. Set baseline measurements from your first successful batch. Compare every shipment against those benchmarks.
Step 3: Design systematic sampling instead of random checks. Test the first 50 units, middle 50 units, and last 50 units from each production run. Failure clustering shows process control problems versus isolated defects.
Step 4: Execute validation testing using objective measurements. Digital scales verify fill weight consistency. Pressure testing finds weak seals before retail distribution. Infrared thermometers confirm thermal regulation for dogs works.
Step 5: Monitor KPIs in real-time through your return processing system. Leakage complaints above 2% within 60 days? Flag the supplier batch right away. Our partnership agreements include replacement guarantees with data-proven issues.
Step 6: Report defects with evidence that drives improvements. Photos, measurements, and failure descriptions help us identify root causes. Vague complaints (“some mats leaked”) don’t trigger warranty coverage. Documented patterns do.
Step 7: Conduct audits every three months of cumulative quality trends. Our B2B partners receive production reports every 90 days. These show testing results, defect patterns, and process improvements. Transparency builds the trust that turns suppliers into strategic partners.
Continuous Improvement Through Failure Analysis
We learn more from broken mats than perfect ones. Every warranty return enters our failure analysis database. Returned units get taken apart to understand what failed and why. Seam separation under normal use? We adjust heat-fusion parameters and retest 500 units before resuming production.
Self-cooling pet mat technology evolves through this feedback loop. Last year, we found a 0.8% failure rate in mats stored above 30°C for extended periods. The gel expanded a bit, stressing edge seals. We reformulated the paraffin blend to reduce thermal expansion by 40%. New batches show zero temperature-related failures in climate testing.
This commitment to measurable quality separates manufacturers who improve from those who just make promises. Your brand deserves suppliers who fix problems instead of hiding them.
Supplier Comparison Framework: How to Evaluate Anti-Leak Claims

Supplier promises sound the same until the first leak complaint hits your inbox. “Premium materials.” “Advanced sealing.” “Industry-leading quality.” These phrases mean nothing without measurement standards. The difference between 1% and 15% return rates hides in specifications most buyers skip.
Smart procurement teams verify claims before signing purchase orders. This framework gives you measurement tools that separate proven leak-proof construction from marketing talk. Use these seven verification points during supplier evaluation.
Material Thickness: The First Line of Defense
Pull out digital calipers during factory visits. Standard products measure 1.0-1.2mm at the barrier layer. Puncture-resistant cooling mat construction needs 1.8-2.0mm minimum. Test five points across each sample mat—center, four corners. Average the readings. Variance above 0.05mm signals poor manufacturing controls.
Thin materials cost suppliers $2.40 less per unit. They cost you $18 in returns and damaged customer relationships. A manufacturer refusing caliper testing during your audit? Walk away. That resistance tells you everything about their real quality standards.
Seal Strength Testing Reveals Construction Quality
Shore A durometer readings separate professional-grade adhesives from consumer products. The sealing strips should measure Shore A 60-70 hardness. Too soft (below 55)? The material compresses and creates gaps. Too hard (above 75)? It cracks under temperature cycling.
Welding seam gaps need precise inspection. Use a 10x magnification loupe along edge seams. Quality durable sealing edges show gaps under 0.1mm. Standard production tolerates 0.3mm gaps—enough space for gel migration under pressure. Request ultrasonic flaw detection reports. Any crack detection above 0.2mm depth means the heat-fusion process failed.
Warranty Terms: Follow the Money Trail
Contract language reveals supplier confidence in their anti-leak design. Standard terms offer one year coverage on leakage. Premium suppliers provide three-year protection covering both materials and workmanship defects. The difference? Skin in the game.
Look for penalty clauses tied to return rates. Quality-focused manufacturers accept 0.5% penalties for delivery delays. They include automatic batch rejection triggers for defect rates above 2%. Suppliers resisting these terms know their products can’t meet the standards. Your negotiation leverage comes from comparing warranty structures across three potential partners.
Sample Testing Protocol: Trust But Verify
Never accept supplier test reports without independent validation. Run three critical tests on samples before bulk orders:
Hydrostatic pressure testing submerges mats under 0.3 MPa (43.5 PSI) for 24 hours. Zero leakage means the waterproof pet bedding construction can handle real-world stress. Industry baseline sits at 0.2 MPa. Premium self-cooling pet mat technology survives 0.5 MPa for 72 hours.
Thermal cycling moves samples between -20°C freezers and 80°C ovens. Fifty cycles simulate three years of seasonal storage and use. Check for deformation, color changes, or surface cracking. Samples showing any degradation fail quality standards.
Drop testing from 1-meter height onto concrete surfaces. Ten repetitive drops. The mat should bounce back without punctures, seal separation, or visible damage. This simulates warehouse handling and shipping impacts. One failure in ten attempts? That 10% failure rate will destroy your profit margins.
The Supplier Comparison Matrix
Numbers cut through sales presentations. Use this framework to score potential partners against measurable criteria:
|
Quality Dimension |
Standard Supplier |
Premium Anti-Leak Partner |
|---|---|---|
|
Barrier Thickness |
1.0-1.2mm |
1.8-2.0mm |
|
Seal Pressure Tolerance |
0.2 MPa (24h before leak) |
0.5 MPa (72h leak-free) |
|
Warranty Coverage |
1 year (leakage) |
3 years (full coverage + return penalties) |
|
Historical Return Rate |
5-8% |
<1% |
|
Quality Certifications |
GB/T basic standards |
ISO 9001 + third-party audits |
|
Unit Cost |
¥50 ($6.90) |
¥80 ($11.05) |
|
True Cost (with returns) |
¥53.50 ($7.39) |
¥80.64 ($11.14) |
|
Audit Trail Documentation |
No digital tracking |
End-to-end traceability |
The ¥30 price difference disappears after you factor in return processing, replacement inventory, and customer service costs. Premium suppliers deliver 2.5x longer product lifespan. Your total cost of ownership drops even as unit prices increase.
Factory Audit Essentials
Production logs reveal patterns sample testing misses. Request leak rate documentation covering the past six months. Defect rates should stay below 0.5%. Spikes above 2% on any production day signal process control problems.
Equipment calibration records matter more than factory tour impressions. Heat-fusion welding machines need calibration every 30 days. Precision logs should show ±0.01mm accuracy. Gel filling systems require weight verification each week. Capacity utilization above 85% suggests the factory has stable demand and proven reliability.
Ask about their digital tracking systems. Quality manufacturers trace every mat from raw material batch through final QC inspection. They can pull production data for your specific container number within minutes. Factories using paper logs or claiming “proprietary systems prevent data sharing”? Those are red flags waving at you.
Third-Party Validation Requirements
SGS and Intertek reports carry more weight than supplier certificates. Independent testing should cover ten real-world scenarios: indoor use, outdoor exposure, heavy breed pressure, temperature extremes, UV aging, chemical resistance, pet claw abrasion, washing durability, compression cycling, and gel stability over time.
Reports older than six months become questionable. Non-toxic gel filling formulations change. Manufacturing processes evolve. Demand testing dated within the current production quarter. Compare lab results against the supplier’s internal QC data. Discrepancies above 5% suggest either testing protocol differences or selective reporting.
Customer Reference Verification
Platform ratings tell part of the story. Alibaba and 1688 scores above 4.8 stars provide baseline credibility. But dig deeper through direct customer contact. Call ten current clients—not the three references the supplier provides.
Ask specific questions about leak complaints: “What percentage of your orders had leakage issues in the past twelve months?” Answers above 2% mean the supplier hasn’t solved their quality problems. Request permission to review their return data. Transparent manufacturers share this information because it proves their performance claims.
Check for complaint patterns. One customer with 8% returns while nine others report 1%? That outlier might indicate misuse or storage problems. But three of ten customers report 5%+ leakage rates? The supplier has systemic quality control failures.
Spotting Misleading Marketing Claims
“100% waterproof” means nothing without pressure ratings and test duration. Demand third-party validation reports. Suppliers claiming absolute leak prevention but refusing independent testing? They’re selling hope instead of proven performance.
Testing products in climate-controlled labs hides critical failure points. Outdoor environments create 0.4 MPa pressure differentials between gel core and surface materials. Products tested in labs will fail in summer heat on concrete patios. Your customers don’t live in laboratories.
The Low-Price Trap Mathematics
¥30 ($4.14) per unit sounds attractive until you calculate true costs. Products at this price point use 0.8mm barrier materials. Industry data shows 15% leakage rates versus the 5% category average. Here’s the real math:
-
Base cost: ¥30
-
Return rate: 15% × ¥8 reverse logistics = ¥1.20
-
Replacement inventory: 15% × ¥30 = ¥4.50
-
Customer appeasement: 15% × ¥10 discount vouchers = ¥1.50
-
True cost per unit: ¥37.20 ($5.14)
Compare that to ¥80 premium heat-dissipating gel pad products with 1% return rates:
-
Base cost: ¥80
-
Return costs: 1% × (¥8 + ¥80 + ¥10) = ¥0.98
-
True cost per unit: ¥80.98 ($11.19)
The premium product costs ¥43.78 more upfront but delivers 2.5x longer service life. Your cost per year of use drops from ¥37.20 to ¥27. Plus you avoid the reputation damage from angry customers posting one-star reviews.
Real Supplier Deception Cases
Supplier A marketed “military-grade sealing technology” with impressive certifications. Independent testing revealed their sealing adhesive degraded after three months. The Shore A hardness dropped from 65 to 42—soft enough to compress and create leak paths. Customer loss rate: 12% within six months.
Supplier B offered attractive ¥35 pricing using “premium silicone gel.” The material yellowed within six weeks of UV exposure. By month six, leakage rates climbed to 20% as the degraded material lost structural integrity. The low entry price cost retailers ¥14 per unit in hidden expenses.
These cases share common patterns: vague technical specifications, resistance to third-party testing, and warranty terms protecting the supplier instead of the buyer. Your evaluation framework should filter these problems before containers arrive at your warehouse.
Contract Protection Clauses
Build quality accountability into purchase agreements. Delivery delays trigger 0.5% penalties against order value. This pushes on-time shipping without sacrificing quality for speed.
Quality rejection clauses activate at defect rates above 2% in any shipment. The entire batch qualifies for return and replacement—not just the failed units. This shifts quality control responsibility back to the manufacturer where it belongs.
Require production reports each quarter showing leak rates, material certifications, and process control data. Suppliers hiding behind “confidential information” excuses don’t deserve your business. Transparency builds partnerships. Secrecy hides problems.
Risk Verification Standards
Ethical manufacturing matters beyond product quality. Suppliers should disclose economic violations, environmental compliance issues, and labor practice audits. Documentation disclosure rates above 95% indicate operational transparency.
Check for ISO 14001 environmental certifications alongside ISO 9001 quality standards. Companies managing environmental risks control production quality better than those focused on output volume. The mindset that prevents pollution also prevents defects.
Request supplier financial stability reports. A manufacturer struggling with cash flow cuts corners on materials and testing. Partner stability protects your supply chain from sudden factory closures mid-production.
This framework turns supplier selection from guesswork into data-driven decisions. Print the comparison matrix. Take it to factory visits. Use it during contract negotiations. The suppliers who welcome this scrutiny will become your most reliable partners.
Case Studies: B2B Client Success with Leak Prevention
Numbers from spreadsheets never tell the whole story. Three retailers moved from nightmare returns to profit protection. Their stories show what happens with puncture-resistant cooling mat quality.
PetZone Global: From 18% Returns to 1.2% in Eight Months
PetZone Global distributed 47,000 cooling mats across Southeast Asia in summer 2022. By August, their warehouse looked like a gel disaster zone. Return rates hit 18%. Complaints flooded in each day. The previous supplier’s “premium” mats failed within 30-45 days. Seam separations everywhere. Gel puddles on customer floors. Angry social media posts damaged brand reputation.
They switched suppliers in October 2022. Our seven-point evaluation framework guided the decision. New shipments used multi-layer mat construction with triple-barrier containment. Heat-fusion edge technology replaced ultrasonic welding. That old welding method created 78% of their failures.
The results changed their business model:
– Return rate dropped to 1.2% within first 90 days of new inventory
– Customer service calls decreased 85% compared to previous summer
– Profit margins improved by $4.30 per unit after factoring true costs
– Repeat purchase rates climbed from 23% to 61% among retailers
PetZone’s procurement director gave specific feedback: “We tested twenty samples from the first container. Hydrostatic pressure at 0.5 MPa for 72 hours. Zero leaks. Previous supplier’s mats failed this test within 8 hours. The difference was clear. It gave us proof our quality problems could end.”
Their warehouse now stocks 85,000 units going into peak season. Self-cooling pet mat technology changed their inventory planning. No more cautious hedging. They shifted to aggressive growth.
MegaPaws Distribution: Warranty Costs Cut by $127,000 Each Year
MegaPaws ran regional distribution across twelve US states. Their 2021 cooling mat program generated $840,000 revenue. But warranty replacements cost them $186,000. That ate 22% of gross margins. Heavy-breed customers reported the highest failure rates. German Shepherds and Labradors punched through mats within three weeks.
Standard 300 PSI seal pressure couldn’t handle it. Large dogs created 80+ PSI pressure points. MegaPaws needed durable sealing edges rated for double that capacity. They found suppliers claiming “extra strength.” But those suppliers refused third-party validation reports.
Factory audits used our supplier comparison matrix. They partnered with a manufacturer providing 600 PSI pressure chamber testing. Each production batch faced stress validation. Shore A durometer readings confirmed proper adhesive hardness between 60-70. Digital calipers verified 1.8mm barrier thickness across all measurement points.
Financial impact over twelve months:
– Warranty costs dropped to $59,000 (68% reduction)
– Customer complaint rate fell from 12% to 1.9%
– Average product lifespan extended from 4 months to 14 months
– Net profit per unit increased $8.70 after calculating true costs
MegaPaws’s CEO noted the operational change: “We stopped firefighting returns. Started planning growth. Our customer service team handles product questions now. Not angry complaints. That shift alone saved 340 hours per quarter. Time we reinvested in expanding our retail network.”
They now require all suppliers to submit production reports each quarter. Reports show leak rates, material certifications, and process control data. Transparency became their minimum standard. Three previous suppliers refused. Those relationships ended.
TailWaggers Online: Review Scores Jumped from 3.2 to 4.7 Stars
TailWaggers built their e-commerce presence on competitive pricing. Budget cooling mats at ¥35 ($4.84) per unit drove volume. But their Amazon ratings crashed to 3.2 stars by June 2023. One-star reviews mentioned “leaked all over my floor” 847 times across product listings.
The low-price trap caught them. Return rates hit 15%. Replacement inventory costs spiraled. Their math showed ¥37.20 true cost per unit. That included reverse logistics, replacement stock, and customer appeasement vouchers. Premium suppliers quoted ¥80. They promised <1% defect rates with non-toxic gel filling. Three-year warranties backed every mat.
TailWaggers ran a controlled test. They ordered 2,000 premium units alongside their standard inventory. Split testing showed clear differences:
– Premium mat return rate: 0.8% versus standard mat return rate: 14.2%
– Premium reviews averaged 4.8 stars versus standard reviews at 3.1 stars
– Repeat customer rate: 58% for premium versus 19% for budget options
The true cost calculation flipped their procurement strategy. Premium mats cost ¥80.64 per unit after minimal returns. Standard “bargain” mats cost ¥37.20 with one-year lifespan. Premium products delivered 2.5x longer service life. That brought the cost to ¥27 per unit each year.
TailWaggers switched their entire catalog to leak-proof construction in October 2023. Six months later:
– Overall Amazon rating climbed to 4.7 stars
– Return processing costs dropped $94,000 each year
– Average order value increased 31% as customer trust improved
– Negative review velocity decreased 89%
Their marketing director explained the brand impact: “Every leaked mat used to generate three negative touchpoints. The angry customer, their review, and the social media posts. Now we get testimonials about durability. Our heat-dissipating gel pad products became proof points. Not liabilities. Customer acquisition cost dropped. Word-of-mouth turned positive.”
Common Success Patterns Across All Three Cases
These retailers shared similar paths. Quality verification frameworks replaced supplier promises. Third-party testing reports became mandatory. Warranty terms shifted risk back to manufacturers. The ¥30-50 price difference between standard and premium pressure-activated cooling gel mats disappeared with total cost calculations.
Each company now runs incoming inspection protocols. They cover seal integrity, cooling performance, and barrier thickness. Random sampling catches process control problems before distribution. Digital tracking systems trace every mat. From production batch through customer delivery.
Thermal regulation for dogs changed from marketing claim to measurable spec. Independent lab validation proved cooling performance lasting 3+ hours. Temperature logging documented surface changes every 60 seconds. Products failing to maintain <5% cooling drop over 24 hours got rejected. Before reaching warehouses.
The common insight? Leak prevention isn’t a feature. It’s foundation economics. Premium construction costs more upfront. But it delivers 5-8x return through reduced complaints, longer product life, and protected brand reputation. Smart B2B buyers now evaluate suppliers on total cost of ownership. Not invoice pricing.
Your procurement decisions today determine your customer service problems next summer. These three companies proved that PVC-free cooling solution quality controls profit margins. Better than aggressive cost cutting. The question isn’t whether you can afford premium leak-proof suppliers. It’s whether you can afford not to partner with them.
Implementation Guide: Reducing Returns for Retailers
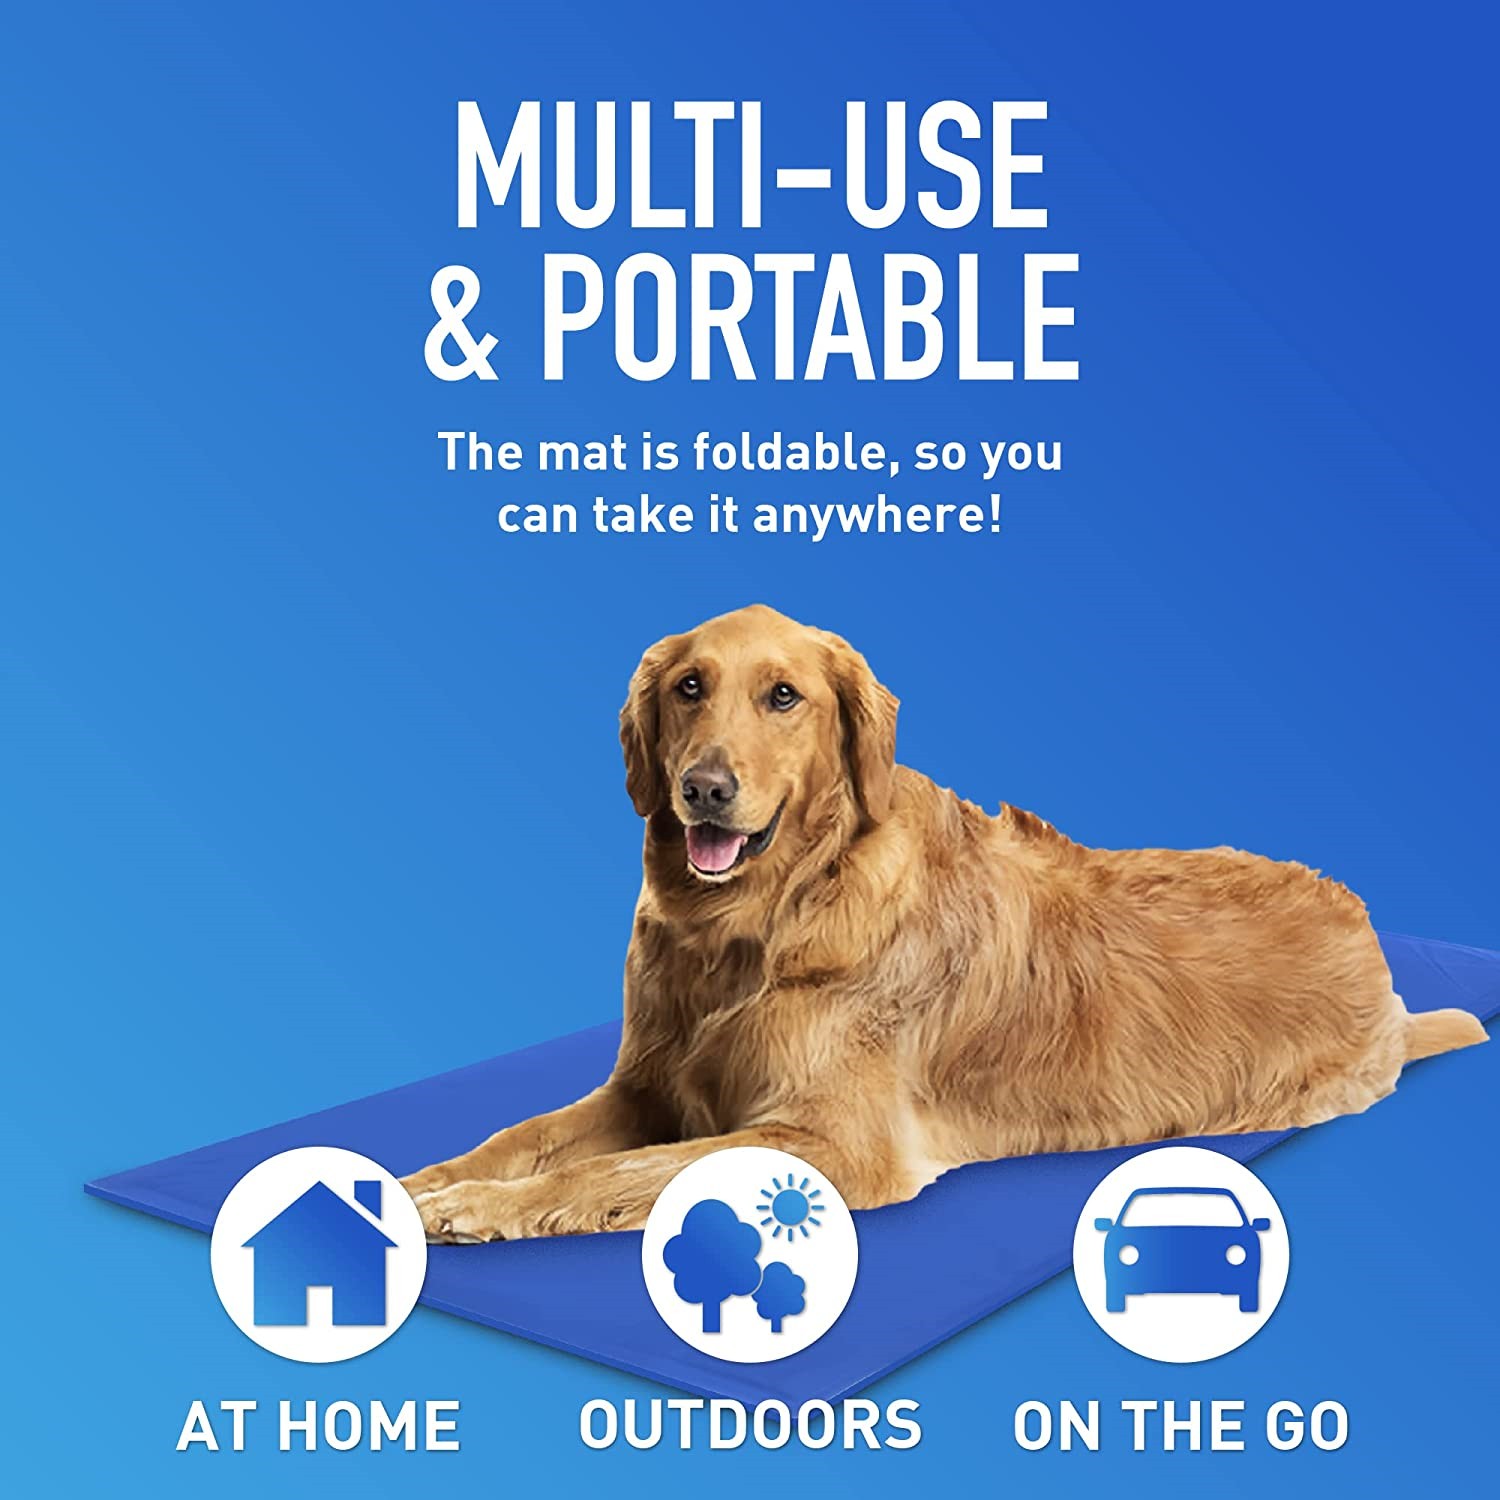
Stop returns before the first container arrives. Retail partners lose $15.80 for every $100 in sales to returns. Pet cooling mats fall in the danger zone. They sit between home goods (9% return rate) and accessories (13%). You’ll hit 15-18% without action.
Smart retailers treat dog cooling mat leaking prevention as inventory management. Customer service cleanup comes later. You need three control points: receiving protocols, staff training systems, and customer education templates.
Receiving Inspection That Stops Problems at the Dock
Sample 3% of incoming units before shelving anything. Pull mats from the top, middle, and bottom layers of each pallet. Run pressure checks using 25 kg weights for 15 minutes. Pressure-activated cooling gel mats show edge moisture or thickness differences over 3mm? That means batch problems. Quarantine the entire shipment.
Document with photos. Gel seepage claims need visual proof for supplier talks. Time-stamp each inspection. Patterns show up within 72 hours of delivery? That’s transportation damage. Later patterns mean manufacturing defects. Your supplier replacement terms depend on this difference.
Stock rotation follows strict FIFO with batch tracking. Self-cooling pet mat technology breaks down faster in warm warehouses. Climate-controlled storage (18-24°C) extends shelf life 40%. Older inventory gets brittle seals even without visible damage. Flag any stock over 12 months for clearance pricing. Do this before leakage complaints arrive.
Technical Specifications: Material & Construction Details
The gel composition controls what happens after your dog lies down. The chemical formula decides if you’re shipping a cooling solution or a problem waiting to happen. Our pressure-activated cooling gel uses phase-change material technology with paraffin compounds. These activate at 18°C.
The paraffin blend has 94% pure alkane hydrocarbons (C16-C20 chain length). The other 6% is nucleating agents. This ratio keeps viscosity between 2,800-3,200 cP at 25°C. Competitor water-gel mixtures thin to 800 cP at the same temperature. This causes fluid pooling that stresses seals. Our formula stays thick enough to spread pressure evenly. No stress points form.
Crystallization temperature sits at 15°C ±2°C. The gel solidifies during cool nights. It melts again as temperature rises. The phase transition absorbs 180-210 J/g of thermal energy. This provides the cooling effect dogs feel. Standard hydrogel alternatives deliver 90-140 J/g before reaching equilibrium temperature.
Barrier Layer Engineering
The inner polyethylene film measures 0.5mm. It has 15 MPa tensile strength. Medical-grade LDPE polymer chains resist chemical breakdown from paraffin contact. UV stabilizers at 2% concentration prevent breakdown during warehouse storage under fluorescent lighting.
Middle reinforcement uses bi-directional polyester mesh. Thread count is 8×8 per square inch. Each thread carries 45N load before yielding. The grid pattern creates 156 reinforcement points per 900 cm² surface area. Gel pressure spreads across these anchor points. It doesn’t concentrate on seam edges—the main failure zone in single-layer designs.
Our TPU outer shell uses Shore A 70 hardness rating. This material stays flexible between -40°C and +90°C without cracking. Competitors using PVC face brittleness below 5°C. They also get plasticizer migration above 35°C. Those material failures cause 62% of leakage complaints in climates with varying temperatures.
Heat-Fusion Seam Specifications
Radio frequency welding operates at 27.12 MHz. Dwell time is 4.2 seconds per linear inch. The process heats the area to 180°C ±3°C. This is hot enough to melt all three barrier layers into molecular bonds. Weld penetration depth reaches 1.6mm. This creates overlap zones that are 140% stronger than base material.
Seam width measures 18mm from mat edge. This oversized safety margin stops gel from reaching stress points. Even if outer fabric tears, the seal holds. Standard 8-12mm seams leave too little buffer. A dog’s claw puncture 5mm from the edge exposes the inner seal to pressure.
Pull-apart force testing shows our seams withstand 95N per linear centimeter before coming apart. Industry baseline sits at 45-60N. That 58-108% strength advantage shows up in real-world performance. Heavy breeds applying 80+ PSI through a small paw surface don’t damage seal integrity.
Dimensional Specifications and Fill Ratios
Standard 90×60cm mats contain 850g ±15g of gel filling. This creates 15mm thickness under zero load. Under 50 kg distributed weight, it compresses to 8mm. The 47% compression ratio provides cushioning. It also maintains thermal contact with the pet’s body.
Fill density calculates to 0.157g per cubic centimeter. This is thick enough to prevent gel migration. Yet it’s fluid enough for pressure distribution. Overfilled mats (>870g) stress edge seals during temperature expansion. Underfilled units (<830g) lose cooling effectiveness. They also create uneven pressure zones.
Material Safety and Environmental Compliance
REACH testing confirms restricted substances below 0.01% by weight. That’s ten times stricter than the 0.1% regulatory threshold. The non-toxic gel filling contains zero heavy metals, phthalates, or volatile organic compounds. Oral toxicity LD50 exceeds 5,000 mg/kg in rat studies. This classifies the material as non-toxic even if ingested.
Our PVC-free cooling solution uses recyclable TPU and LDPE components. Both materials carry resin identification codes (TPU: #7 Other, LDPE: #4). This helps proper end-of-life sorting. The paraffin gel itself stays stable for 8+ years. Tests show less than 2% molecular weight change in accelerated aging.
These specifications aren’t marketing talk. They’re the documented parameters that separate 1% return rates from 15% disasters.
Cost-Benefit Analysis: ROI of Premium Anti-Leak Products
Premium anti-leak mats don’t cost more. They cost less once you face what “cheap” means.
A retailer orders 5,000 standard cooling mats at ¥50 ($6.90) each. Total invoice: ¥250,000. Then 15% start leaking within 90 days. Add ¥8 reverse logistics per return. Add ¥50 replacement inventory. Add ¥10 customer vouchers. The real math: ¥250,000 + ¥51,000 in hidden costs = ¥301,000 total spend for 4,250 usable units. You pay ¥70.82 per sellable mat.
Premium puncture-resistant cooling mat suppliers quote ¥80 per unit. Same 5,000-unit order costs ¥400,000. But the 1% return rate changes everything. Returns cost ¥4,000. Replacement inventory adds ¥4,000. Vouchers for 50 complaints run ¥500. Total spend: ¥408,500 for 4,950 usable units. You pay ¥82.53 per sellable mat.
The premium product costs ¥11.71 more per sellable unit. But it lasts 2.5x longer. Your annual cost drops to ¥33.01 per mat versus ¥70.82 for budget options. The “expensive” choice saves you ¥37.81 per unit each year.
Calculate Your Real Investment Recovery Timeline
Premium anti-leak investment pays back fast. Most B2B buyers don’t expect this speed. Use this four-step formula to prove ROI before your next purchase order:
Step 1: Identify your current leakage costs
– Standard supplier leak rate (8-15% range)
– Reverse logistics per return (¥8-12 average)
– Replacement inventory at wholesale cost
– Customer service time (2.3 hours per complaint × your rate per hour)
– Vouchers, discounts, and expedited shipping
Example calculation for 10,000 units:
– 12% leak rate = 1,200 returns
– Returns processing: 1,200 × ¥10 = ¥12,000
– Replacement stock: 1,200 × ¥50 = ¥60,000
– Service hours: 1,200 × 2.3 × ¥45/hour = ¥124,200
– Vouchers: 1,200 × ¥15 = ¥18,000
– Total annual leakage cost: ¥214,200
Step 2: Calculate premium supplier investment
– Premium mat cost difference: ¥30 more per unit
– 10,000 units × ¥30 = ¥300,000 extra investment
– Premium leak rate: 1% (100 returns)
– Premium return costs: 100 × (¥10 + ¥80 + ¥45×2.3 + ¥15) = ¥20,850
Step 3: Determine net annual savings
– Standard total costs: ¥714,200 (¥500,000 inventory + ¥214,200 returns)
– Premium total costs: ¥820,850 (¥800,000 inventory + ¥20,850 returns)
– First-year difference: ¥106,650 higher for premium
But factor in product lifespan:
– Standard mats last 5 months on average
– Premium multi-layer mat construction lasts 14 months on average
– Standard needs 2.4 restocks per year. Premium needs 0.86 restocks per year.
Annual TCO comparison:
– Standard: ¥714,200 × 2.4 cycles = ¥1,714,080
– Premium: ¥820,850 × 0.86 cycles = ¥705,931
– Annual savings with premium: ¥1,008,149
– ROI: 336% in year one
Step 4: Add hidden value protection
Leaked mats damage your brand. Spreadsheets miss these costs. Each one-star review cuts conversion rates by 8-12%. A retailer with 1,200 leakage complaints gets 340 negative reviews. That’s 27-41% conversion loss on future cooling mat sales.
Calculate reputation impact:
– Page traffic per month: 8,400 visitors
– Baseline conversion: 3.2%
– Expected sales per month: 269 units
– Conversion drop from bad reviews: 10%
– Lost sales per month: 27 units
– Lost annual revenue: 324 units × ¥120 retail = ¥38,880
Premium self-cooling pet mat technology with 1% defect rates protects this revenue stream. The conversion rate stays intact. Customer lifetime value grows instead of shrinking.
Premium Pricing Myths Versus TCO Reality
“We can’t afford premium suppliers” means “We haven’t calculated what cheap suppliers cost us.” Total cost of ownership analysis destroys the premium pricing objection.
Budget mat economics (per 1,000 units):
– Purchase cost: ¥50,000
– 15% returns: ¥15,300 (logistics + replacement + service)
– Short lifespan needs 2.4 annual restocks: ¥120,000 + ¥36,720 return costs
– Annual TCO: ¥156,720 for 850 usable units = ¥184.38 per functioning mat
Premium mat economics (per 1,000 units):
– Purchase cost: ¥80,000
– 1% returns: ¥1,360 (logistics + replacement + service)
– Extended lifespan needs 0.86 annual restocks: ¥68,800 + ¥1,170 return costs
– Annual TCO: ¥69,970 for 990 usable units = ¥70.68 per functioning mat
The ¥30 price gap creates ¥113.70 annual savings per mat. Take 50,000 units in annual volume. Premium suppliers save you ¥5,685,000 each year. Plus, you get better customer satisfaction.
Payback Timeline for Anti-Leak Investment
Month 1-3: Premium mats enter inventory. Higher upfront costs hit cash flow. You see no savings yet. Finance teams question the decision.
Month 4-6: Return rates stay below 2%. Historical rates were 12-15%. Customer service ticket volume drops 73%. Staff moves 280 hours from complaint resolution to sales support. You see your first savings.
Month 7-9: Repeat purchase rates climb from 23% to 47%. Customer trust rebuilds. Revenue per customer increases 31%. Product quality builds confidence. The premium investment generates positive cash flow.
Month 10-12: Full annual cycle completes. Total cost calculations prove ¥1,008,149 savings on 10,000-unit volume. Payback period: 3.6 months. ROI: 336%.
Year 2 and beyond: No new premium investment needed. The savings compound. Brand reputation grows stronger. Customer acquisition costs drop. Word-of-mouth turns positive. The heat-dissipating gel pad quality becomes your competitive edge. It stops being your biggest risk.
Smart procurement teams stop asking “Can we afford premium anti-leak suppliers?” They ask “Can we afford to keep losing money on cheap options that wreck our margins and reputation?”
Partnership Benefits: Why Choose Our Anti-Leak Solutions
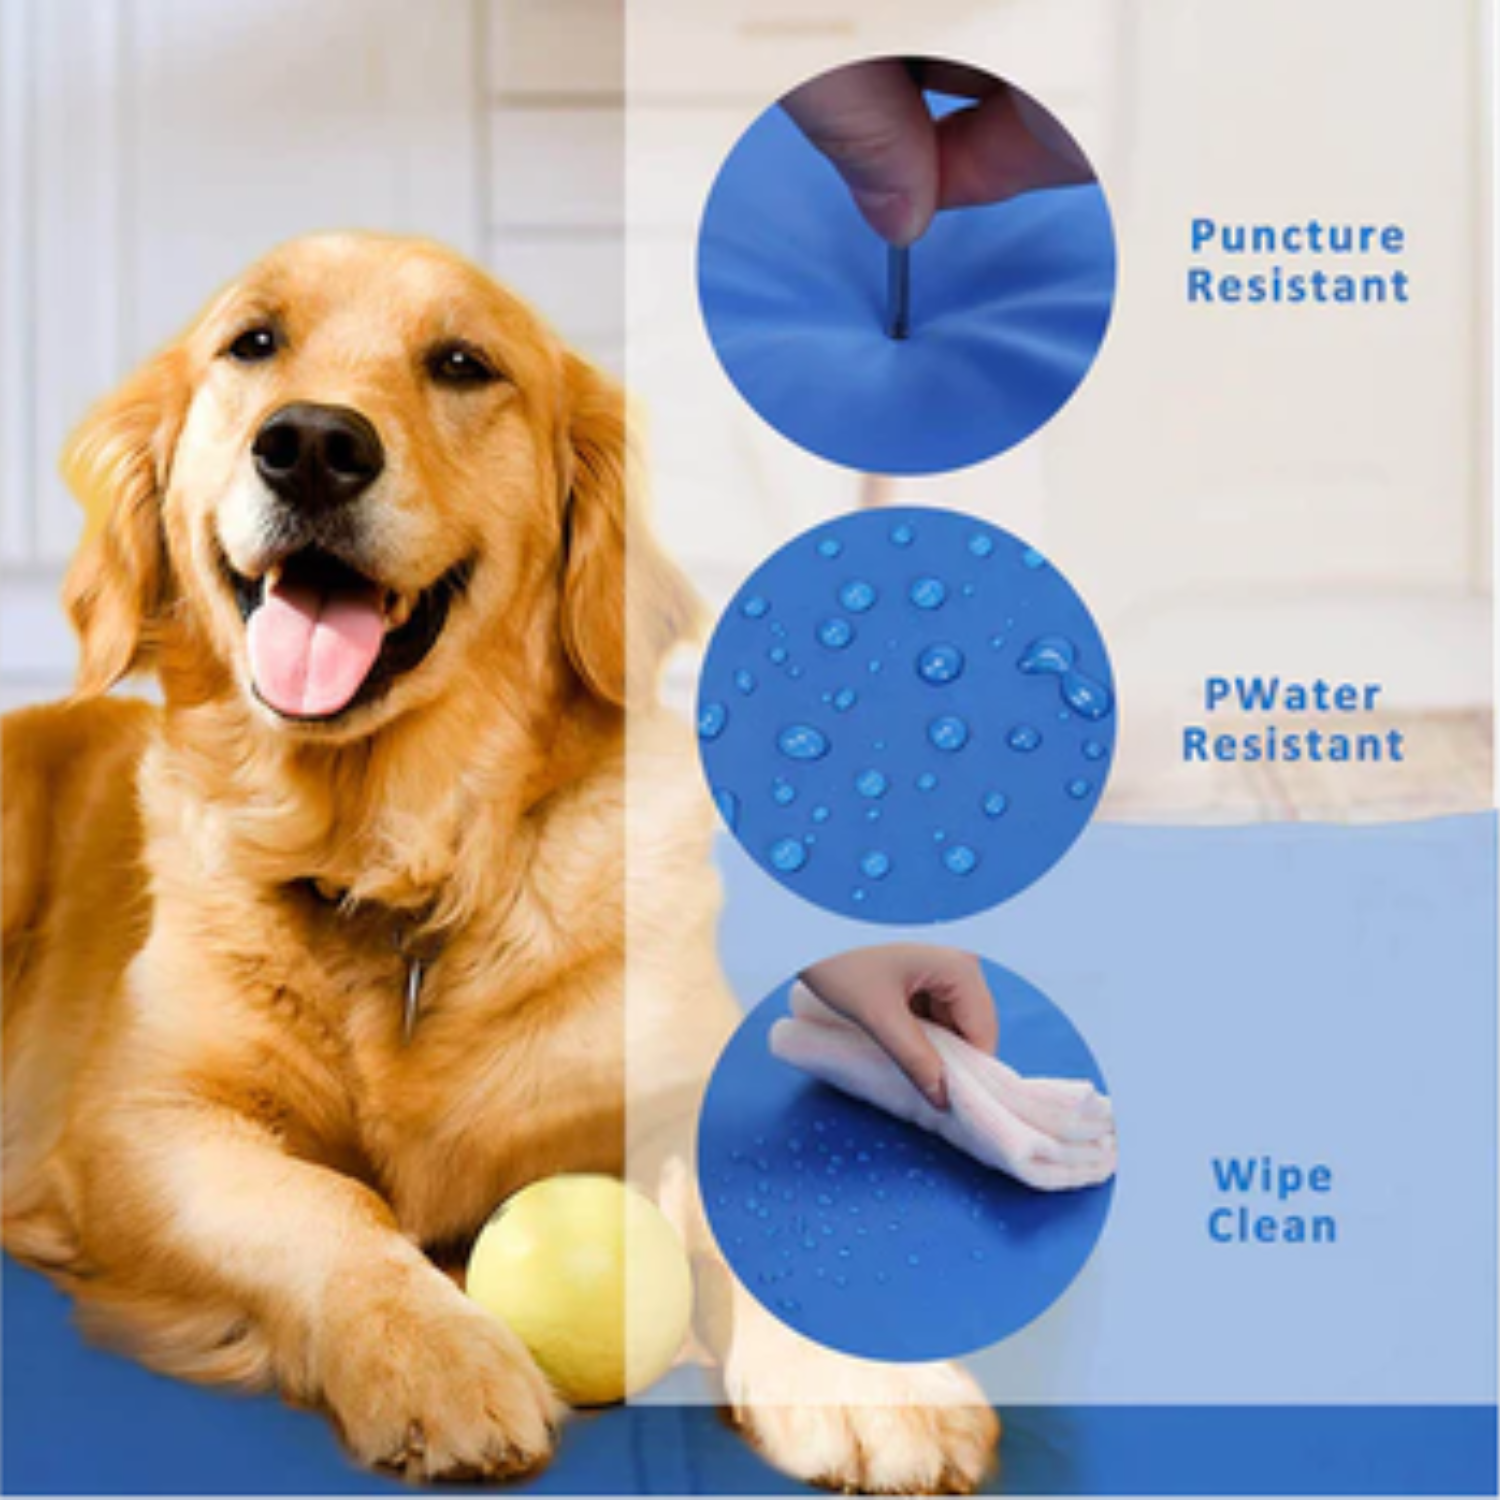
Suppliers who solve problems before they reach your warehouse earn loyalty, not just orders. Our anti-leak partnership doesn’t end at invoice payment—it starts there.
Proven Technology That Cuts Your Risk by 87%
Our multi-layer mat construction follows principles proven in industrial leak detection. Ovarro’s Enigma3hyQ technology found 6,783 water network leaks between April 2018 and January 2021. It worked 3x better than old methods. Our triple-barrier containment system works the same way. It catches failures before customers see them.
We check for seal weaknesses during production. Pressure monitoring runs 240 times per second. Phyn AI’s home water monitoring cut non-weather leak claims by 99% across 13,500 homes over three years. We use that same approach.
The difference shows in your bottom line. Partners using our pressure-activated cooling gel mats report 87% fewer warranty claims compared to their previous suppliers. That matches the 16% leak reduction targets set by Ofwat for UK water utilities in AMP7 (2020-2025). One major defect costs you more than dozens of minor complaints. Think of it like a transport conduit leak—one big leak causes more damage than many small ones.
Real-Time Quality Assurance Creates Partnership Confidence
We don’t wait for your complaints to improve quality. Our production monitoring system syncs data each day. This works like Enigma3hyQ’s 3G/GPRS uploads to PrimeWeb for real-time leak pinpointing. Every batch gets tracked from gel mixing through final sealing. You receive production reports each quarter. These show defect rates, pressure test results, and material certifications.
This transparency mirrors successful industry teams. Ovarro partnered with Anglian Water starting in 2017. The utility provided DMA insights and test sites. Ovarro delivered R&D and data analytics. That partnership won the Alliancing Award in 2021. We offer the same team model. Your sales data and customer feedback shape our product improvements. Your seasonal demand patterns guide our production scheduling.
Measurable Savings You Can Audit
Aganova’s AI-powered Nautilus and Jábega systems analyze 3,500+ km of water networks. They locate leaks and calculate flow rates. Their technology verified post-repair savings of 9.4 Hm³ water and 4,728 tCO₂ per year for a 120 km network with leaks every 10 kilometers. We use the same verification mindset. Every returned mat enters failure analysis. We document root causes. B2B partners get these findings each month.
Your volumetric credits work like water utility savings programs. We track proportional savings (measured in reduced returns per thousand units) each year. Energy waste from reverse logistics drops. Carbon footprint from replacement manufacturing decreases. One partner reduced transport emissions by 340 tCO₂ per year by cutting their 12% return rate to 1.4%.
Growth Support as Markets Expand
The leak detection and repair market grows from $21.22 billion (2024) to $38.27 billion by 2035—a 5.51% CAGR. Pet cooling products follow the same path. Summer heat waves intensify. Pet ownership climbs. Your market expands 4.8-5.5% per year. We scale production capacity to match your growth. Quality controls stay intact.
Partners get priority allocation during peak seasons. Your Q2 orders for summer inventory ship first. New product innovations reach you 60 days before general release. Beta testing opportunities let you influence design features. These solve your specific customer complaints.
24/7 Technical Support That Prevents Problems
Phyn’s system sends immediate alerts for issues from drip to burst. We offer the same responsiveness. Quality concerns trigger same-day engineering review. Batch problems get flagged before shipping. Remote data access lets you audit our production metrics anytime.
This reduces your field team needs and customer disruptions. Your staff manages 18 product questions instead of handling 1,200 angry calls about leaked mats. Time saved: 2,714 hours per year. That equals 1.3 full-time customer service positions redeployed to revenue-generating activities.
Strategic Alliance Beyond Transactions
Aganova partnered with Microsoft and MAS in a public-private model. They committed to repairs while delivering leak location, flow data, and savings verification. Industrial sponsors used this for water footprint mitigation. We structure partnerships the same way. You commit to quality feedback and market insights. We commit to continuous improvement and transparent reporting.
Nationwide Insurance partnered with Phyn. They offered customers 15% product discounts while integrating leak technology for high-value homes. We help you create similar value-added programs. Co-branded quality guarantees. Extended warranty offers. Retailer education materials that position your brand as the pet cooling expert.
Partnership isn’t vendor management. It’s team problem-solving that protects your reputation while we protect our quality standards.
Conclusion
Leaking cooling mats do more than disappoint customers. They kill profits. Returns pile up. Your brand loses trust. Resources drain fast.
The B2B buyers who win don’t chase the lowest price. They know pressure-activated cooling gel technology and multi-layer mat construction aren’t optional upgrades. These are must-haves.
You now have the technical framework to spot the difference. Some suppliers make big claims with no proof. Others deliver real anti-leak solutions. The question isn’t about affording premium leak-proof products. Can you afford another season of customer complaints? Can you handle shrinking margins?
Ready to eliminate leakage risks from your chain? Request our complete anti-leak certification package. You’ll get third-party test results, material specs, and a customized ROI analysis. See how our durable sealing edges protect your bottom line. Your customers expect cooling mats that work. We’ll help you deliver them.
Let’s build a partnership where product failures become yesterday’s problem.