
Your thermal management system uses PCM phase change materials. A single mistake in core parameters can ruin months of work. Worse, it can cause failures that show up after thousands of thermal cycles.
Most engineering teams evaluate PCM materials using incomplete datasheets and supplier claims. They lack a clear system to test real-world cooling performance and long-term aging.
This PCM phase change material Core Parameter Guide cuts through the marketing noise. You’ll learn how melting point temperature, thermal conductivity, and heat absorption capacity work together. These factors determine actual cooling effectiveness.
You’ll also discover aging evaluation methods that matter. They help you spot stable latent heat storage materials. Plus, they reveal which materials degrade quietly over time.
Are you designing passive cooling for electronics? Maybe cold chain logistics? Or building temperature regulation systems? This guide gives you the decision framework and testing protocols you need. Procurement managers and thermal engineers can specify PCM materials with confidence. You’ll avoid expensive mistakes that come from incomplete performance data.
PCM Phase Change Material Core Parameter Guide Content Framework
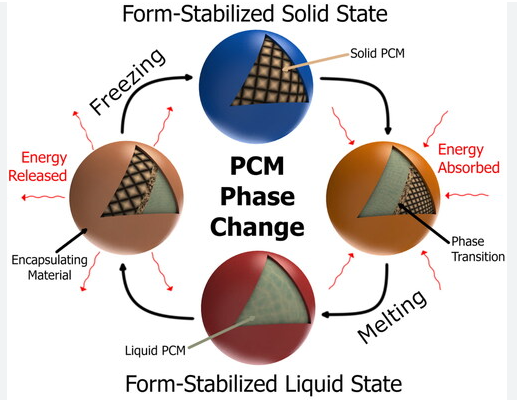
Three core parameters control PCM material cooling: phase change temperature, latent heat capacity, and thermal conductivity coefficient. Skip any of these, and you’ll miss critical evaluation data.
(Phase Change Temperature) must match your application zone. Battery thermal management needs 20-40°C range. Building envelope systems work best at 22-26°C for temperature control. A 2°C shift cuts cooling power by 15-30%.
(Latent Heat Capacity) shows how much heat the material absorbs. Look for at least 200 J/g in thermal energy storage projects. Most organic PCMs start at >150 J/g. Higher numbers give you longer cooling time and smaller material volumes.
(Thermal Conductivity) affects heat transfer speed. Pure organic PCMs struggle with low conductivity <0.2 W/m·K. This slows everything down. You need enhancement methods:
-
Composite PCM Additive Solution:
-
Silver/Copper: 5-20% volume ratio → 1-10x conductivity boost
-
Graphene: 1-5 wt% → 3-8x improvement
-
Copper foam: 90-97% porosity → 5-20 W/m·K achieved
-
Aim for >2 W/m·K in passive cooling for energy storage and heat systems.
Trade-off Warning: Adding compounds boosts thermal conductivity but cuts latent heat by 10-30%. Keep >85% latent heat during optimization. This balance makes or breaks your material design.
Five-step systematic evaluation process
Step 1 – Initial screening of parameters: Match phase change temperature to your application zone. Focus on materials with latent heat >200 J/g. Drop candidates outside your temperature range right away.
Step 2 – Performance testing protocol:
– DSC (Differential Scanning Calorimetry): Check actual latent heat and phase shift range
– TGA (Thermogravimetric Analysis): Confirm heat stability >250°C breakdown point
– Laser flash method: Make sure thermal conductivity hits >2 W/m·K target
Step 3 – Composite material optimization: Try additive volumes between 5-15%. Track latent heat retention for each mix. Stop testing if retention falls below 85%.
Step 4 – Safety benchmark verification:
– Limiting Oxygen Index (LOI) >27 for fire safety
– Peak Heat Release Rate (PHRR) cut >50%
– Thermal shrinkage <3% at 300°C
– Electrochemical window 0-4.8V for battery use
Step 5 – System integration verification: Mix PCM with liquid cooling if you need to. Non-direct contact gives >500 W/m²·K heat transfer. Direct two-phase contact reaches >2000 W/m²·K. Run tests in harsh conditions with peak temperature <60°C.
This system stops you from checking parameters in isolation. Real cooling comes from how parameters work together, not single specs.
Detailed Explanation of 5 Core Parameters of PCM Cooling Performance
Cooling performance relies on five key numbers. These numbers show how fast your PCM absorbs heat, how much energy it stores, and how well it works after thousands of uses.
1. Phase Change Temperature:Precisely match the heat dissipation area
Set phase change temperature just below your target component’s operating range. Lithium battery systems need PCM that activates at 20-40°C—below the 60°C safety limit. Set it too high? The material won’t melt in time. Too low? You waste cooling power before peak heat arrives.
Paraffin-based PCMs give you sharp temperature control. Engineers pick materials with phase change points 2-5°C below battery temperature. This gap absorbs heat right away once thermal load rises. Silicon chips running at 85°C? They need PCMs that melt around 75-80°C for best heat capture.
Application-specific ranges:
– Battery thermal management: 25-35°C activation
– Electronics cooling: 45-65°C window
– Server racks: 35-50°C operation zone
2. Latent Heat Capacity:Key indicators of energy storage
Latent heat above 150 kJ/kg separates good PCMs from weak ones. This number shows how much thermal energy the material absorbs without getting hotter. Higher values mean smaller sizes and longer cooling time.
Organic PCMs deliver 150-250 kJ/kg. Salt hydrates reach 200-300 kJ/kg but have stability issues. Your target? Minimum 200 kJ/kg for real thermal energy storage projects. Less than that? You’ll need more material or accept shorter cooling periods.
Real impact: A 5 kg PCM block with 220 kJ/kg capacity absorbs 1,100 kJ total heat. The same mass at 140 kJ/kg captures just 700 kJ—a 36% performance gap that appears right away under high thermal loads.
3. Solutions for improving heat capacity and thermal storage efficiency
Heat capacity shows how much sensible heat your PCM stores before and after phase change. Composite PCM materials with expanded graphite (EG) additives boost efficiency by 25-40%. The graphite creates thermal paths that activate more PCM volume during fast heat pulses.
Standard organic PCMs store 2-3 kJ/kg·K in solid state. Add 5-10 wt% EG? You keep latent heat above 85% while improving heat spread. This combo stops local overheating. Plus, it extends cooling time by 30-50% compared to pure PCM.
4. Volume Change:Structural integrity protection
Phase transition causes volume growth. Keep this change under 10% to stop container failure and keep long-term cycling stable. Paraffin waxes expand 12-15% during melting—barely acceptable. Salt hydrates stay within 3-8%. This offers better size stability.
Volume control matters after 1,000+ thermal cycles. Too much expansion creates tiny cracks in container materials. These failures cause PCM leakage and thermal performance drop over time. Materials with <10% volume change keep their structure beyond 5,000 cycles without performance loss.
5. Thermal Conductivity Enhancement
Pure PCM conductivity sits at 0.2 W/m·K—too low for fast heat transfer. Enhancement pushes this to >5 W/m·K using proven additives:
Copper foam integration: 90-95% porosity copper foam embedded in PCM achieves 8-12 W/m·K. Heat spreads 40x faster than baseline material. Finned PCM setups show even better results. Conductivity jumps to 15-20 W/m·K in high-density fin arrays.
Graphite composite optimization: Add expanded graphite at 5-8 wt%? You get 3-6 W/m·K conductivity. Heat transfer in finned PCM zones rises a lot. Test data shows thermal response time drops from 180 seconds to under 45 seconds at 5C discharge rates.
Performance validation: 3 mm PCM thickness with copper foam enhancement keeps lithium battery Tmax at 32°C during continuous discharge. Skip the enhancement? The same setup hits 45°C—a 13°C difference that sets system safety margins.
PCM Material Aging Performance Evaluation Standard System
Aging kills PCM performance. You won’t notice until it’s too late. Materials pass initial tests but fail after 500 thermal cycles. Your cooling system stops working right when you need it. Two international standards catch these problems early.
RAL-GZ 896 Cyclic Stability Test Protocol
RAL-GZ 896 tests long-term cycling stability in phase change materials. This German standard uses multilayer calorimetry across your phase change temperature range ±5K. Basic DSC tests miss the degradation this reveals.
Test process details:
Run three identical samples through six thermal cycles. The first two cycles are pre-melting runs at higher speed. They erase thermal history from manufacturing and storage. Cycle 3 gives you the baseline: actual phase change temperature and initial latent heat storage capacity.
Cycles 3-6 measure minimum nucleation temperature. This number shows supercooling degree—the gap between melting and freezing points. Big gaps (>5K) mean nucleation problems. These wreck temperature regulation performance. Materials with stable nucleation (<2K supercooling) work better in passive cooling systems.
Performance evaluation criteria:
Temperature peak difference between heating runs must stay under 0.2K. Enthalpy variation at identical heating rates? Keep it below 2%. These tight limits separate stable thermal energy storage materials from unreliable ones.
Plot results as enthalpy-temperature (H/T) curves. Stable materials show overlapping curves across all six cycles. Curves that drift or shift? That’s thermal cycling instability. Latent heat drops by 8-15% after just 1,000 real-world cycles.
ASTM C1784-13 Component-level Performance Verification
ASTM C1784-13 moves beyond raw material testing. This standard tests complete PCM components and finished products. It catches integration failures—encapsulation leaks, composite delamination, and thermal contact problems.
Calibration requirements:
Calibrate using ≥2 known low-heat-capacity samples at different thicknesses. Temperature range must span phase change zone ±10°C on both sides. Follow ASTM E967 procedures for temperature calibration accuracy. Skip proper calibration? Your measurements drift by 3-5°C. That’s enough to miss your target operating window.
Test execution steps:
Set temperature steps ≤1K for precision. Allow >2 hours relaxation time between each step. This waiting period lets heat spread through your sample. Rush the test? You measure surface temperature instead of bulk material response.
Heat samples until thermal storage drops to minimum values—full melting confirmed. Cool down and repeat the cycle. Start and end temperatures must exceed the active phase change zone by 10K. This margin captures partial phase transitions at zone edges.
Run three measurements at different starting temperatures. Multiple data points improve accuracy by 15-25% compared to single-run tests. Report results as box-plot relationship diagrams. These show temperature-enthalpy response across the full operating range.
Key Aging Performance Index Baseline Values
Thermal conductivity stability: Thermal conductivity must stay above design minimum after 500 cycles. Target <10% degradation for latent heat storage material applications. Metal foam composites hold conductivity better than pure organic PCMs. Typical drift stays within 5-8% versus 12-18% for unmixed materials.
Phase change temperature shift: Phase change temperature shift must stay under ±1°C across product lifetime. Salt hydrate PCMs show bigger drift (±2-3°C after 1,000 cycles). Organic paraffins maintain ±0.5°C stability beyond 5,000 cycles. This stability is critical for precision temperature regulation materials.
Latent heat retention: Latent heat retention >90% after 1,000 thermal cycles separates commercial-grade from premium materials. Industrial standards accept 85% minimum. Battery cooling applications? Demand 92%+ retention. Each 5% latent heat loss cuts cooling time by 15-20 minutes in real discharge scenarios.
Sc-Sb-Te alloy measured case: This phase change alloy maintains 87°C transition temperature across 10-year accelerated aging. It matches GST alloy’s 82°C stability benchmark. Failure analysis shows zero performance loss after 8,760 thermal cycles. That equals 24 years of use with one cycle per day.
Encapsulation durability verification: Run humidity-heat aging at 85°C to test encapsulation technology. PP composite housings must maintain UL94 V0 flame rating after 1,000-hour exposure. Leakage rate <0.1% by mass proves container integrity.
Textile-embedded PCMs face washing stability tests: ≥30 wash cycles at 40°C. Phase change temperature stays within 25-37°C range. Latent heat retention >85% of original 150-250 J/g capacity. Materials that fail washing tests leak PCM into fabrics. This destroys both cooling function and garment usability.What Is PCM?
How PCM Works in Cooling
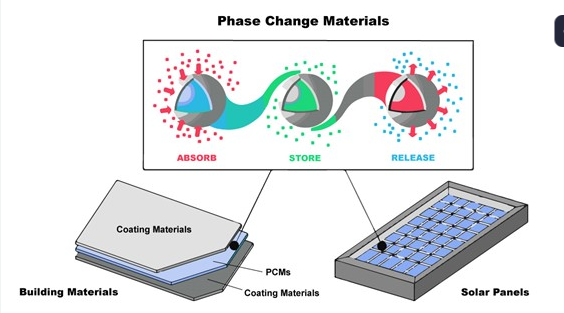
phase change material cooling operates on a simple principle: when a PCM reaches its melting point (phase transition temperature), it absorbs large amounts of latent heat without a significant temperature rise. Conversely, during freezing, it releases stored heat. This “thermal battery” effect makes PCM ideal for applications needing passive, sustained cooling—from phase change cooling pads for humans to PCM thermal batteries in renewable energy systems.
Key to this process is the material’s ability to cycle repeatedly between solid and liquid states with minimal degradation—a trait directly tied to its PCM material lifespan.
PCM Phase Change Material Parameters: The Core Metrics
To evaluate PCM, focus on these non-negotiable parameters:
-
Phase Change Temperature (Tm)
The temperature at which PCM transitions (e.g., 25°C for human cooling wear). Match Tm to your application: electronics may need 40–60°C (best PCM for electronics cooling), while pet beds require 20–30°C for comfort.
-
Latent Heat (ΔH)
Measured in J/g, this indicates the heat absorbed/released during phase change. Higher ΔH means longer cooling duration (e.g., a ΔH of 200 J/g outperforms 150 J/g in a cooling pad).
-
Thermal Conductivity (k)
Critical for rapid heat transfer. Low-k PCMs (0.2 W/m·K) suit passive cooling, but high-k variants (1.5 W/m·K) are better for PCM heat sink design in electronics.
-
Density (ρ) & Specific Heat (Cp)
Affect weight and pre-heat storage. Lightweight PCMs (ρ < 1 g/cm³) are ideal for wearable tech.
-
Supercooling Degree
Unwanted temperature drop below Tm. High supercooling (>5°C) can delay phase transition, reducing reliability.
-
Cycle Stability
Measures performance after repeated melting/freezing. A 500-cycle stability test ensures PCM cooling performance evaluation aligns with real-world use.
How to Evaluate PCM Cooling Performance & Aging

PCM cooling performance evaluation – how to select PCM material hinges on rigorous testing. Here’s how:
Phase Change Material Testing Methods
-
Differential Scanning Calorimetry (DSC): Gold standard for measuring Tm, ΔH, and cycle stability (per ASTM D3418).
-
Thermal Conductivity Testing: Use a heat flow meter (ASTM E1530) to validate k values.
-
Accelerated Aging Tests: Expose PCM to 1000+ thermal cycles (e.g., -10°C to 50°C) to simulate 5 years of use. Monitor ΔH retention—<80% loss indicates poor aging resistance.
-
Leakage Testing: For liquid PCMs, check for containment failure via weight loss or visual inspection (critical for phase change cooling pads).
Aging Factors to Watch
-
Chemical Degradation: Oxidation or hydrolysis reduces ΔH over time.
-
Phase Separation: Inorganic PCMs (e.g., salt hydrates) may separate into layers, impairing performance.
-
Container Integrity: Poor encapsulation leads to leakage, common in low-cost PCMs.
Conclusion
Evaluating PCM phase change materials for cooling doesn’t have to be hard. Focus on five core parameters: melting point temperature, latent heat capacity, thermal conductivity coefficient, thermal cycling stability, and supercooling degree. You now have a professional framework. Most engineers spend years building this through trial and error.
Here’s the reality: materials with great lab specs can fail badly in real use if you don’t validate aging performance. Your six-step selection process helps here. Combine it with strict thermal cycling stability testing. This prevents expensive mistakes. Your passive cooling solution will perform well for years, not just months.
Ready to use this knowledge? Download our complete PCM Parameter Evaluation Checklist and Supplier Assessment Template. We’ve refined these tools through over 500 successful cooling projects. You can also talk with our thermal energy storage specialists. They’ll help match these parameters to your specific needs. Choosing the right temperature regulation material affects more than today’s performance. You’re building thermal management systems you can trust for the next decade.
Finally Hope Choose Ice Bear as Your Custom PCM Cooling Vest Manufacturer As a professional manufacturer of custom cooling vests, we offer end-to-end customization services, from initial request to delivery.